
Chris Grigsby
Welcome to this page. It's free.

How I Built a SIEM Using Suricata and Elastic Stack for My Home Network
Table of Contents
- Purpose
- Tools and Installation
- Recap
- Tuning
- NAS Server Detection - SSH - SMB - Web Portal - Port Scanning
- Web Application Rules - Authentication Bypass via SQLi - Excessive Permissions - Login Brute Force
- Auditbeat
- Final Thoughts
Purpose
Last week, I completed a blog post outlining how to use some Free Open-Source Software (FOSS) and commercial tools to analyze an intentionally vulnerable web application. Now I want to focus on a different side of security, specifically the Security Operations Center (SOC), by installing and configuring an Intrusion Detection System (IDS) to generate alerts on my home network and send them to a Security Information and Event Management (SIEM) tool. I will focus on using FOSS tools, including Suricata for IDS, and an Elastic Stackfor analysis and visualization. This is a widely used combination of Elasticsearch for search and analytics, Filebeat for data ingestion, and Kibana for visualization. I will also be using Auditbeat for endpoint monitoring. This project will help me learn and display skills relevant to an SOC career, as well as potentially even detect intruders on my home network, by testing alerts for a Network Attached Storage (NAS) Server, a web application, and my own computer’s audit events.

Tools and Installation
There’s a lot to get to here, so I’ll have to install each of the tools and their dependencies, configure them, and then eventually tweak them to make sure I am able to use them properly. For reference I am using Linux Mint Debian Edition (LMDE 6) which is Dual-Booted on an Intel Mini PC with 16 GB RAM. Nothing special.
For the Elastic Stack, I am more or less going to be following along with this guide, but I will make a few changes as well, largely because that guide refers to a VM setup that won’t apply here. Because I am testing, I will be running Suricata and Kibana from the same host, therefore I won’t need to change some of the configurations the same way.
Suricata Install and Configuration
According to their website Suricata is a “a high performance, open source network analysis and threat detection software.” Apparently it’s also a species of mongoose, but for this post we’ll just be referring to the software. This software reads incoming traffic, and uses rules which we can download or create ourselves to alert us if there is anything suspicious going on, or more suspicious than usual anyway. For Debian, installation is easy, simply:
sudo apt install suricata.- We can confirm that it is working with
sudo systemctl enable suricata.servicewhich should return:Synchronizing state of suricata.service with SysV service script with /lib/systemd/systemd-sysv-install. Executing: /lib/systemd/systemd-sysv-install enable suricata
Next we need to configure a few things, and I’ll be following along with this guide. The configuration file can be found at /etc/suricata/suricata.yaml. By default it is almost 2000 lines long, so I won’t copy it here, but I’ll try to give line numbers to make it easier.
- The guide recommends enabling community flow ID “make it easier to match individual event records to records in datasets generated by other tools”. Good enough for me.
- On line 132, change the file to read:
community-id: true
- On line 132, change the file to read:
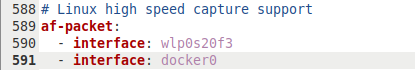
- Next you need to determine which network interface to use. For me, that’s my WiFi network where the interface is called
wlp0s20f3which I can find usingifconfig.- Lines 587-589 should read:
```
Linux high speed capture support
af-packet:
- interface: wlp0s20f3 ```
- Lines 587-589 should read:
```
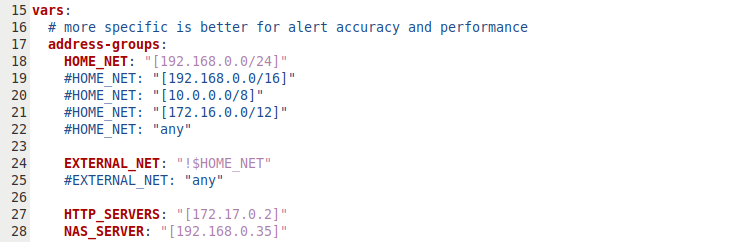
- The guide doesn’t address it, but by default Suricata is set up to inspect traffic on all private networks that it has access to. I’m going to keep it to
192.168.0.0/24, and I’m also going to define myNAS_SERVERandHTTP_SERVERSsince those are what I’m going to focus on. Note thatEXTERNAL_NETis defined as anything outside theHOME_NET.- Lines 15-28 for me read:
vars:
  # more specific is better for alert accuracy and performance
  address-groups:
    HOME_NET: "[192.168.0.0/24]"
    #HOME_NET: "[192.168.0.0/16]"
    #HOME_NET: "[10.0.0.0/8]"
    #HOME_NET: "[172.16.0.0/12]"
    #HOME_NET: "any"

    EXTERNAL_NET: "!$HOME_NET"
    #EXTERNAL_NET: "any"

    HTTP_SERVERS: "[192.168.0.46]"
    NAS_SERVER: "[192.168.0.35]"
Note that the 4th line and 2nd to last lines have changed, and the last line has been added.
- We also need to update Suricata’s rules or the IDS won’t have anything to base on alert on. It’s possible that we may need to configure new rules later (or clear this file entirely so I actually have something to create), but for now this will work.
- Run
sudo suricata-update -o /etc/suricata/rules.
- Run
- Finally we can test the configuration.
- Run
sudo suricata -T -c /etc/suricata/suricata.yaml -v.
- Run
We should get something like this:
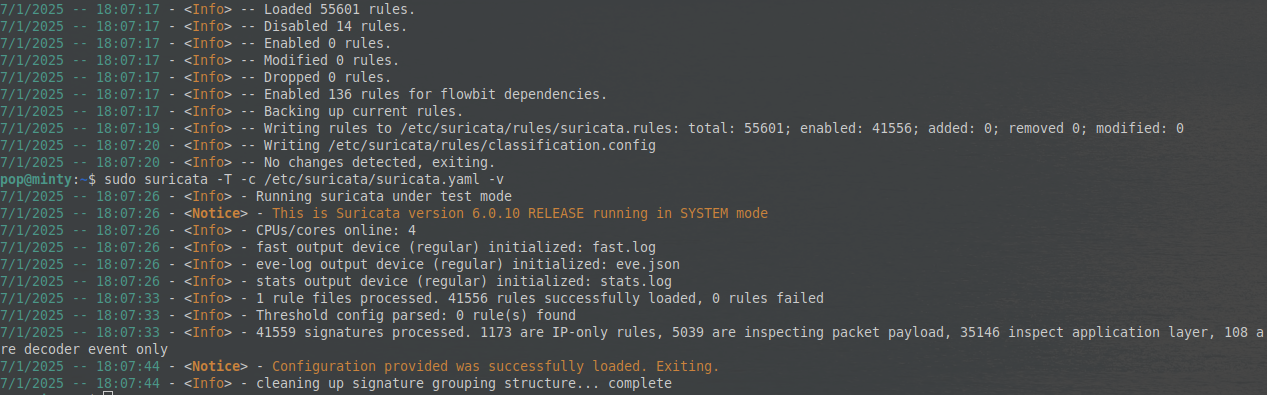
And that should do it for Suricata.
Elasticsearch
According to their websiteis “an open source distributed, RESTful search and analytics engine, scalable data store, and vector database capable of addressing a growing number of use cases.” Basically it is a search engine that indexes data in such a way that it can search through it very quickly even if there is a tremendous amount of data. Elastic provides a guide to make installation simple:
- Download and install the public signing key:
wget -qO - https://artifacts.elastic.co/GPG-KEY-elasticsearch | sudo gpg --dearmor -o /usr/share/keyrings/elasticsearch-keyring.gpg
- Save the repository definition to
/etc/apt/sources.list.d/elastic-8.x.list:-
echo “deb [signed-by=/usr/share/keyrings/elasticsearch-keyring.gpg] https://artifacts.elastic.co/packages/8.x/apt stable main” sudo tee /etc/apt/sources.list.d/elastic-8.x.list`
-
- Use
apt-getto install the application:sudo apt update && sudo apt install elasticsearch
Easy peasy.
Config
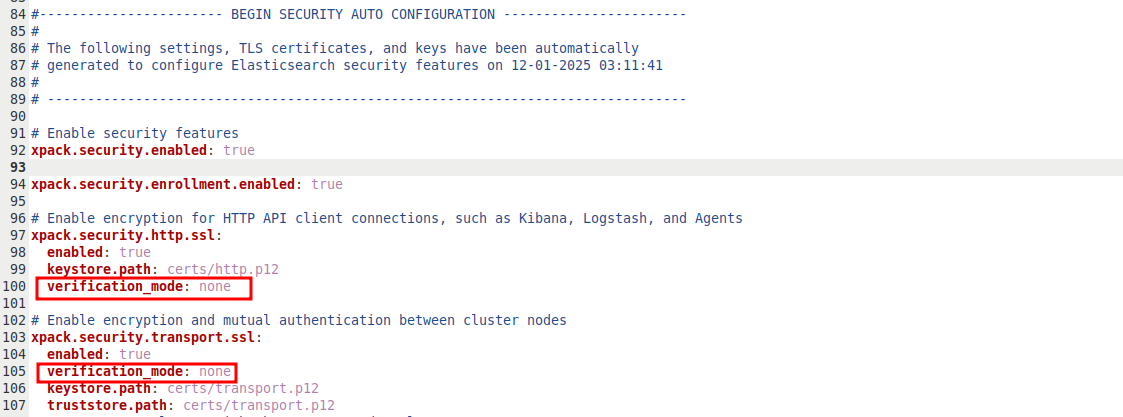
The configuration file is called /etc/elasticsearch/elasticsearch.yml, so any changes we need to make will be there. By default, the network host used by Elasticsearch is localhost, and the port is 9200. If you want to change those, the parameters are network.host and http.port. The only change we need to make in our case is adding two lines to disable verification. These will be under the xpack.security.http.ssl and xpack.security.transport.ssl sections, and should look like this:
Next we need to generate passwords. Technically these are printed to the console when we first install Elasticsearch, but I missed them, and they are easy enough to reset. According to this post, you can generate them all at once, but we just need two - the password for the elastic user and the kibana_system user. We can generate them with:
sudo /usr/share/elasticsearch/bin/elastic-reset-password -u elasticsudo /usr/share/elasticsearch/bin/elastic-reset-password -u kibana_system.
Make sure to save these somewhere. Then we can run sudo systemctl start elasticsearch to start the program. We can confirm everything is working properly by running this command, using the password we just generated for the elastic user:
curl -X GET -u elastic:$Password "localhost:9200"
Kibana
Elastic also owns Kibana and which is a tool for performing data analytics “on any data from any source, from threat intelligence to search analytics, logs to application monitoring, and much more.” Think of it as the front end. Suricata creates alerts, Logstash ingests and transforms them if necessary, Elasticsearch indexes and provides searching, and Kibana enables us to visualize them. Again, it is very simple to install:
- Install Kibana using
apt-get:sudo apt-get install kibana
Config
The first step will be to generate encryption keys using sudo /usr/share/kibana/bin/kibana-encryption-keys generate -q. The output will look like this:
xpack.encryptedSavedObjects.encryptionKey: f******************************9
xpack.reporting.encryptionKey: a******************************8
xpack.security.encryptionKey: 2******************************3
We just need to paste these lines at the very end of the config file at /etc/kibana/kibana.yml. Then we need to add the kibana_system credentials that we generated earlier to the config file. We can search kibana_system in the file and see that there is already a space for them with a value of changeme for the password. Add the password we generated earlier and uncomment the lines.
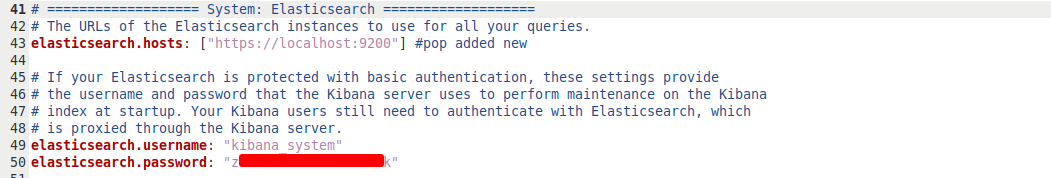
Alternatively, we can create a service account credential token for Kibana. We can use this so that Kibana can authenticate to Elasticsearch without us needing to login. We can create this token by running :curl -k -X POST -u elastic:$Password "https://localhost:9200/_security/service/elastic/kibana/credential/token/kibana-token" where the Password is the one we’ve just generated. This will print the token to the console, and we can add it to the /etc/kibana/kibana.yml file as the value for the elasticsearch.serviceAccountToken parameter. For me this is on line 55.
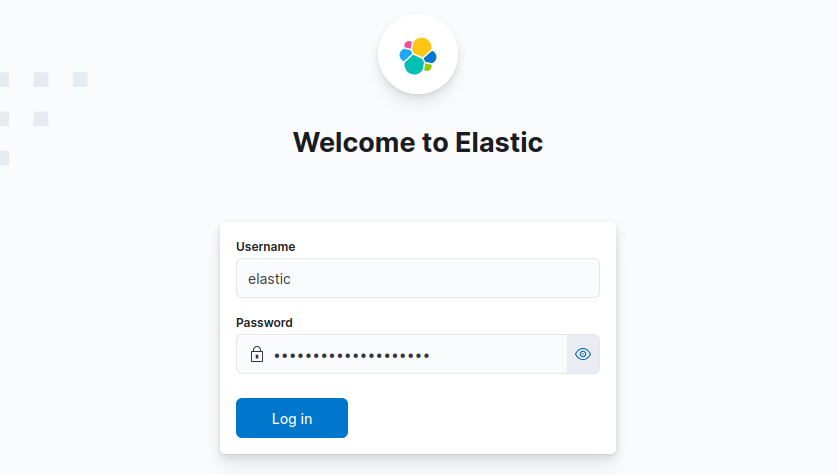
Next we can start the application by running sudo systemctl start kibana. It will take a few minutes to load, but then we can see it in the browser by going to localhost:9200, but we can log in with the credentials for the elastic user that we generated earlier.
At this point, you may want to create a new user so we aren’t using the system account, but you can follow the directions in here for that.
Filebeat
Owned Elastic Filebeat is “a free, open-source log collector that monitors log files and forwards them to Elasticsearch or Logstash for indexing.” What we now call the Elastic stack used to be called the ELK stack, with Logstash instead of Filebeat. They perform similar duties, but Logstash is less resource-intensive and more popular these days, so I’ll be using that. (I also tried Logstash first, and had some issues with it hanging a few times while trying to follow a different guide). Like the others, it is simple to install with: sudo apt-get install filebeat.
Config
Similar to the others, the config file can be found at /etc/filebeat/filebeat.yml. We can scroll down to the Elasticsearch Output section and add the elastic user’s password, as well as the line ssl.verification_mode: "none" underneath. At this point, the guide I’ve been following called out a bug with importing modules on Elasticsearch 8.x, which I am using, and I took special care to pay attention to the next few lines. We can scroll to the Filebeat modules section and comment everything out, then add the following lines:
filebeat.modules:
	- module: suricata
	  eve:
		  enabled: true
		  var.paths: ["/etc/log/suricata/eve.json"]
Then we run this command to force the Suricata module : sudo filebeat setup --pipelines --modules suricata -M "suricata.eve.enabled=true" -c /etc/filebeat/filebeat.yml. After that, we can finally run the command which “Sets up the initial environment, including the index template, ILM policy and write alias, Kibana dashboards (when available), and machine learning jobs (when available).”
Then we can start the service: sudo systemctl start filebeat.
Auditbeat
Because the guide suggested it, I’m going to go ahead and setup Auditbeat as well. It’s not inherently a part of the Elastic Stack, but it’s good to have, and we might be able to generate some useful alerts. To put it simply, Auditbeat is going to be more focused on auditing my host rather than the other data generated by Suricata which will be watching the network. We can install it the same way with sudo apt-get install auditbeat.
Config
Similar story to the others, we need to open /etc/auditbeat/auditbeat.yml so we can add the password of the elastic user and also add the line below: ssl.verification_mode: "none".

Next, we run sudo systemctl start auditbeat, so we should be done with our installations and move on.
Recap
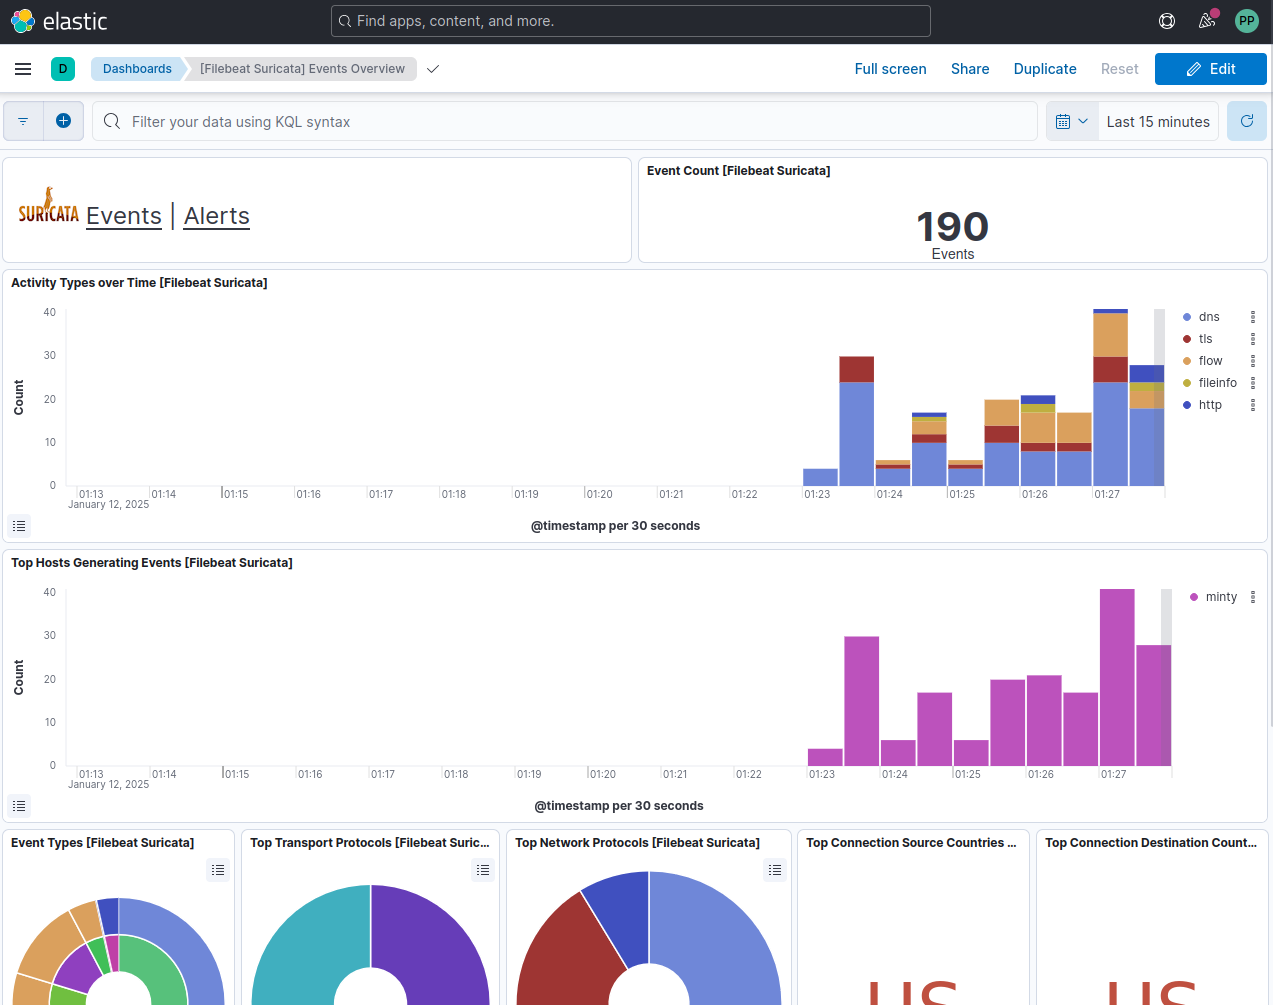
At this point, we have installed everything we need - Suricata, Elasticsearch, Kibana, and Filebeat (and Auditbeat). We may need to restart them for any of out later configuration changes to take effect, but we can do that with sudo systemctl restart $serviceName. Once everything is up and running, we should be able to log in on port 5601 and navigate to Suricata Events Overview by searching it in the search bar. It should start to fill up and look like this:
Tuning
Now that we have the SIEM up and running, it’s time to write some custom Suricata alerts that are specific to our use case. In order to do this, I am going to comment out the default suricata-rules in the /etc/suricata/suricata.yml file. We can then create new rule files in /etc/suricata/rules/ and add them to the yaml file. It should look like this, for me on lines 1922-1924:
rule-files:
  #- suricata.rules
  - $rule-file.rules
So to clarify, we will be creating a new /etc/suricata/rules/$rule-file.rules for each of the next examples. I want to write some rule files to send alerts on two systems:
- A NAS server
- A vulnerable web application
And then I will go over how to use Auditbeat to send audit logs from my machine directly to the SIEM as Suricata is not needed.
Sample Rule
Before I do that, let’s break down a sample rule:
# Sample Rules
$action $protocol src_IP src_Port -> dest_IP dest_Port (
	msg:"This is a description we will see in the alert later";
	flow:$direction,$description;
	classtype:$class-type;
	sid:1000001;
	rev:1; )
- Action describes what action Suricata will take. We will be using
alertfor all of these, but there are others likedrop,pass, orreject. - Protocol refers to
tcp,udp,icmp, oripwhich basically means any. src_IPandsrc_Portrefer to where the traffic is coming from, such as an attacker.dest_IPanddest_Portrefer to where it is going, such as a target on our internal network.- The
msgcomponent is a short, hopefully helpful description of the rule and what it is doing. - The
flowcomponent describes the direction of the traffic, such asto_serverand potentially a quality of it, such asestablished, which will filter for only traffic where the three-way handshake is established. This component is optional and largely here for additional filtering on rules that have already been created. - The
class-typecomponent is a tag that helps us to organize and prioritize alerts. This can includepolicy-violationorattempted-reconfor example. - The SID is the ID number for Suricata. It is required.
- The
revcomponent refers to the revision of the rule, in case you have several for testing.
NAS Server Alerts
Writing rules for the NAS server should be relatively straightforward. There are three ways to access the device - SSH (port 22), SMB (445), or the web portal (5001), and I want to generate different levels of alerts for each of them. We will put all of these files in a rule file called /etc/suricata/rules/nas-server.rule.
SSH
I want to generate alerts for any attempts to access to the NAS over SSH, as this should only be done by the admin and rarely. We can always tune them down if we need to, but I want to start with every time because it should be rare. To do this we can generate a simple alert:
# SSH Rules
# Detect SSH access
alert ip any any -> $NAS_SERVER 22 (
	msg:"POLICY - SSH attempt to NAS server";
	flow:to_server,established;
	classtype:policy-violation;
	sid:1000001;
	rev:1; )
Remember that we defined the $NAS_SERVER earlier in the /etc/suricata/suricata.yaml file. This rule sends an alert when there is tcp traffic from any IP on any Port to access the NAS IP over port 22. I am leaving flow:to_server,established in here to keep from alerting on a scan for example, which wouldn’t be a real example of a someone actually trying to login via ssh. We could also use ssh instead of ip for the protocol, but I’ll leave it like this because there shouldn’t be any other kinds of traffic anyway, and I’d be curious if there is.
SMB
I want to generate alerts for brute force access to SMB. It’s expected that this server can be in use multiple times a day, and people might have to sign in and out, but we should be able to detect if there are a lot of attempts. For this we need to define what brute forcing should look like, and on the first attempt of this rule, I will define it as 5 login attempts from one source within 30 seconds, as that will be a clear example of a brute force attempt.
# SMB Rules
# Detect potential SMB brute force
alert ip any any -> $NAS_SERVER 445 (
	msg:"ATTACK - Potential SMB brute force against NAS";
	flow:to_server,established;
	detection_filter:track by_src, count 5, seconds 30;
	classtype:policy-violation;
	sid:1000002;
	rev:1; )
So this rule will generate alerts on any access from any IP or port to the NAS server over port 445, but only under specific conditions. The big one here is the linedetection_filter:track by_src, count 5, seconds 30; which creates a threshold before alerting:
track by_src: Counts events from each source IP address separatelycount 5: Must see 5 eventsseconds 30: Within a 30-second window
Web Portal
For this, I just want to generate alerts for any HTTP traffic from an external network. We can configure auto lockout from within the portal, and there shouldn’t much traffic there anyway as it’s more common to access over SMB. In a real scenario, I might do something different, but for the purposes of giving an example, I think it might be better to have a different kind of rule to show.
# Web Portal Rules
alert http $EXTERNAL_NET any -> $NAS_SERVER 5001 (
msg:"POLICY - External access attempt to NAS web portal";
flow:to_server,established;
classtype:policy-violation;
sid:1000005;
rev:1; )
Note for this that $EXTERNAL_NET is also defined in the /etc/suricata/suricata.yaml file as !HOME_NET meaning not the home network of 192.168.0.0/24. So in total, this rule alerts us any time some from outside the home network attempts to use http to access the NAS server on port 5001. In practice, this one is going to be pretty hard to detect because the router shouldn’t allow this traffic anyway.
Port Scanning
While we’re here, we might as well add an additional rule to detect scanning of the NAS.
# Port Scanning Rules
alert ip any any -> $NAS_SERVER any (
	msg:"SCAN - Potential port scan against NAS";
	flow:to_server;
	flags:S,12;
	threshold:type threshold, track by_src, count 5, seconds 60;
	classtype:attempted-recon;
	sid:1000006;
	rev:1; )
The rule is going to create an alert for any IP including internal IPs scanning any port on the NAS. The key components here are flags:S,12 and threshold:type threshold, track by_src, count 5, seconds 60:
- In the
flagscomponent:S: Filters for traffic that matches the TCP SYN flag12: Requires that both reserved bits are clear (normal for legitimate traffic)
- The
thresholdcomponent Similar to detection_filter but slightly different behaviortype threshold: Alert after reaching threshold (vs. detection_filter which resets)track by_src: Count per source IPcount 5: Need 5 eventsseconds 60: Within 60 seconds
- This combination is good for detecting port scans, as scanners often send SYN packets to multiple ports
NAS Server Rule File
The total rule file should look like this and be located at /etc/suricata/rules/nas-server.rules :
# SMB Rules
# Detect SSH access
alert ip any any -> $NAS_SERVER 22 \
	(msg:"POLICY - SSH attempt to NAS server"; \
	flow:to_server,established; \
	classtype:policy-violation; \
	sid:1000001; \
	rev:1;)

# Detect potential SMB brute force
alert ip any any -> $NAS_SERVER 445 \
	(msg:"ATTACK - Potential SMB brute force against NAS"; \
	flow:to_server,established; \
	detection_filter:track by_src, count 5, seconds 30; \
	classtype:policy-violation; \
	sid:1000002; \
	rev:1;)

# Web Portal Rules
alert http $EXTERNAL_NET any -> $NAS_SERVER 5001 \
	(msg:"POLICY - External access attempt to NAS web portal"; \
	flow:to_server,established; \
	classtype:policy-violation; \
	sid:1000003; \
	rev:1;)

# Port Scanning Rules
alert ip any any -> $NAS_SERVER any \
	(msg:"SCAN - Potential port scan against NAS"; \
	flow:to_server; \
	flags:S,12; \
	threshold:type threshold, track by_src, count 5, seconds 60; \
	classtype:attempted-recon; \
	sid:1000004; \
	rev:1;)
Note that this is shown with line breaks (\), but if these aren’t properly set up with no white space after, the rule will break, so in my actually file they aren’t there.
After we’ve created this file and added it to the /etc/suricata/suricata.yml file, we can restart Suricata with sudo systemctl restart suricata.
Testing NAS Rules
I won’t be able to generate any alerts for the third rule most likely because the router will block it, but I can run a few commands from inside my network which should be picked up pretty easily.
- SSH - I can try to log in via ssh with
ssh testattacker@192.168.0.35and then enter any password. - SMB - I can use use a brute forcing tool called hydra to attempt to brute force SMB. You may be able to install it with
sudo apt install hydra, but when I did this, I discovered that this version does not have support for SMB2. Rather than downgrade the NAS, I installed from source by running:git clone https://github.com/vanhauser-thc/thc-hydra.git,- Then installing the listed dependencies with
sudo apt install build-essential libssl-dev libsmbclient-dev libpcap-dev libssh-dev - Then cd’ing into the directory and running
./configure, - Then
make, - And finally
sudo make installI will also need to use a wordlist or two for either the user or password. I’ll keep it consistent withtestattackeras the user and generate password list which I’ll callwordlist.txt. The contents don’t really matter, but I grabbed a couple hundred lines from a popular wordlist calledrockyou.txtwhich you can see here The full command is:hydra -l testattacker -P wordlist.txt 192.168.0.35 smb2.
- Port scan - I can use nmap to run a port scan on the NAS Server with
sudo nmap -sT 192.168.0.35 -p-. This will run a TCP connect scan against all ports.
Results
We can go into Kibana and view the all of the events at Analytics -> Discover. To filter only for the alerts that I generated, we can use this filter in the search bar:
suricata.eve.event_type: "alert" and suricata.eve.alert.signature_id: (1000001 OR 1000002 OR 1000003 OR 1000004).
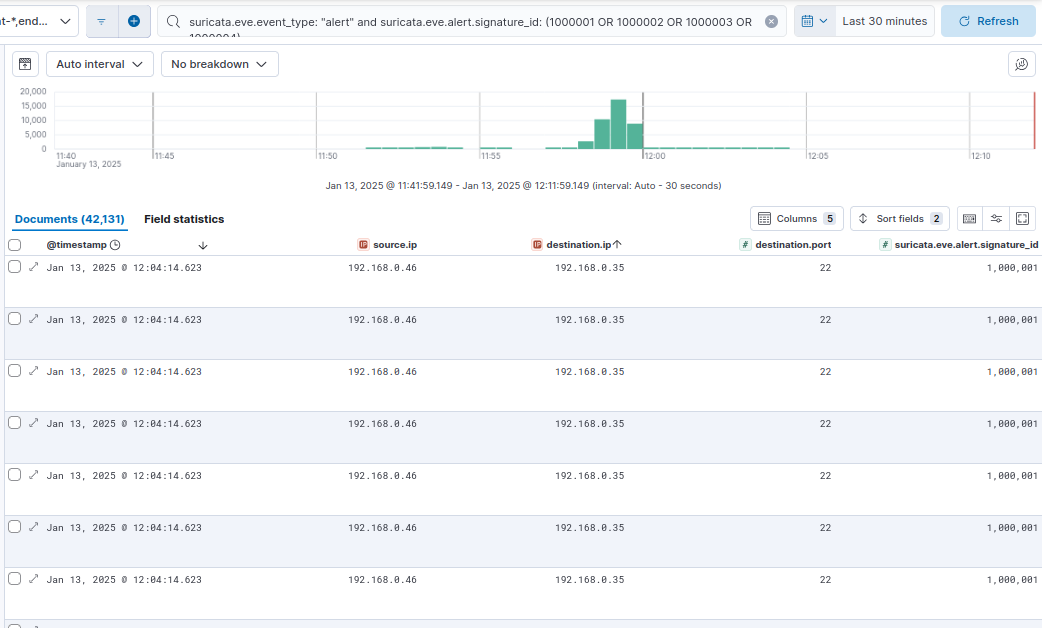
And there’s 40,000 of them, mostly because I ran multiple full port scans to make sure I got some. But we can filter for individual alerts with suricata.eve.alert.signature_id.
SSH Results
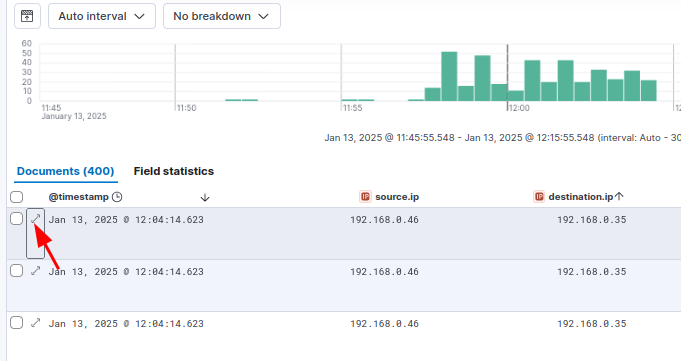
If I want to filter just for attempts to access the NAS Server over SSH, I can use suricata.eve.alert.signature_id: (1000001) which returns 400 documents. I ran Hydra on this as well to generate more, but it would have worked by trying to manually login as well. We can click into one of the documents to see what’s there:
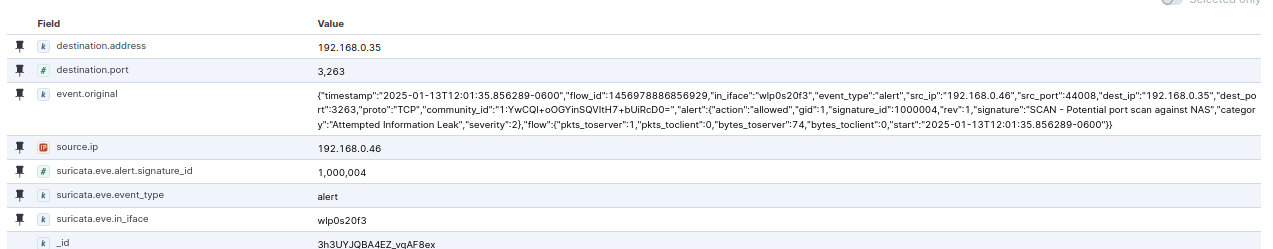
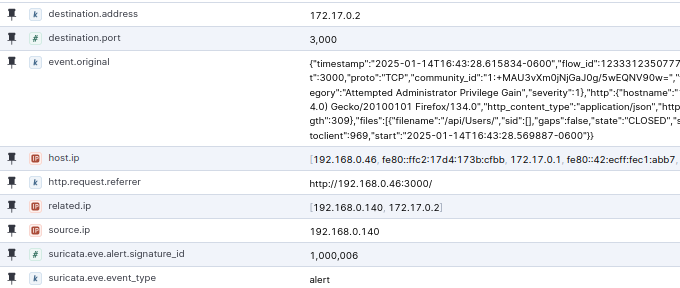
There’s a ton of information in there, but if we pin a few of the fields, it gets a bit easier to see:
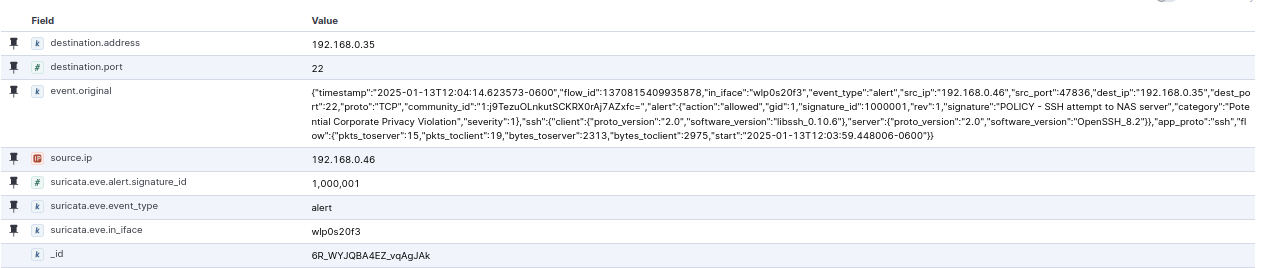
We have our destination address and port, showing that someone attempted to access port 22 at the NAS, we can see the full event, and we can see the sid we created for this rule (1000001).
Port Scan Results
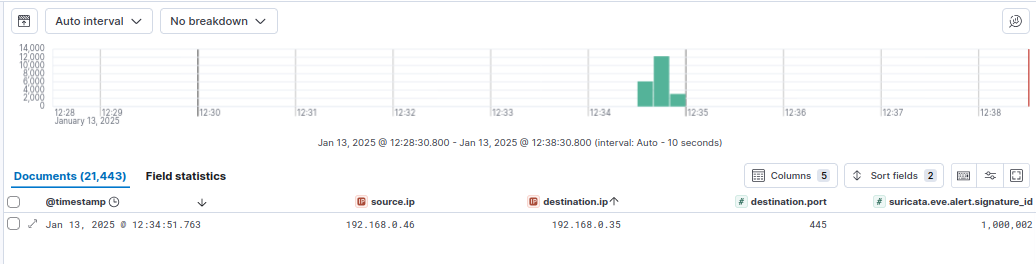
We can do the same thing again for the Port Scanning rule (1000004). This is a whopping 39,366 documents because of how many ports we scanned.
Now the number 39,366 might seem like it doesn’t make a ton of sense because there are 65,535 ports and we set the rule to alert us only when there are 5 attempts in a minute, but it makes more sense when we know that I ran it 3 times. 65,535 / 5 * 3 = 39,321 . The remaining alerts would have just been generated while attempting to brute force SMB or SSH.
SMB Results
Initially I thought that I didn’t get anything back for this rule, so I changed the Hydra command to make more parallel requests by adding the -t 16 flag and ran it a few times: hydra -l testattacker -P wordlist.txt -t 16 192.168.0.35 smb2. Again, I did run it multiple times, but there were only 383 passwords in the wordlist, and somehow this resulted in 21,443 documents.
That seems like way too many, and something I need to figure out how to tune before I used something like this in production, and I was doubly concerned because I thought there were no alerts when I ran it normally, so I would need alerts to both increase in one case and decrease with the -t 16 flag. Then I tried Hydra again without the -t flag, and it worked, but one Hydra run still generated 3,059 Documents.
This one puzzled me for a bit, but I think what ultimately happened is that Suricata was counting each request multiple times. I think because they were happening simultaneously, Suricata considered each request to be the 5th request causing an alert. It’s possible even that it considered each request to be the 5th request in overlapping groups of request if that makes sense. So the 5th packet would generate an alert after packets 1, 2, 3, and 4, but also after packets 1, 2, 3, and 6. I’m not positive.
To test it, I ran the same Hydra command again, and it generated exactly 3,059 alerts again. This suggests to me the there is not just an unpredictable collision of requests causing alerts, but a mathematical equation I should be able to solve. So I re-wrote the rule to generate an alert after 10 attempts:
alert ip any any -> $NAS_SERVER 445 (msg:"ATTACK - Potential SMB brute force against NAS"; flow:to_server,established; detection_filter:track by_src, count 10, seconds 30; classtype:policy-violation; sid:1000002; rev:1;)
Then when I ran Hydra again, I saw 3,054 alerts, 5 fewer. This told me that every request after the first 4 requests triggered some number of alerts after the first rule, and then after 9 requests in the second. Then kept fiddling with it so see what I could find by changing the number of requests that triggered the alert and the size of the wordlist.
| No. of Alerts before Trigger (t) | Requests (r) | No. of Total Alerts (a) |
| ——————————– | ———— | ———————– |
| 5 | 383 | 3,059 |
| 10 | 383 | 3,054 |
| 20 | 383 | 3,044 |
| 20 | 100 | 780 |
| 10 | 100 | 790 |
| 5 | 100 | 795 |
| 5 | 200 | 1595 |
| 5 | 300 | 2395 |
| 5 | 301 | 2403 |
After looking at the data for a bit, we can see that each subsequent request is generating 8 alerts because increasing r by 100 increases a by 800, but increasing r by 1 increases a by 8. Some quick math reveals the function is:
8r - t = a.
Does that help? Not really. It could help to tune the rule, but the current parameters aren’t unreasonable, and I would potentially need to change t so much to affect a that I would miss true positives. Instead I am going to add a threshold setting (we can and probably should do this to the port scanning rule as well) that ensures after the initial detection, I can limit the number of alerts. The line looks like this:
threshold: type threshold, track by_src, count 20, seconds 60;
This will track alerts by the source, count to 20 attempts and alert as long as they are within a 60 second window. This is different because the detection_filter was set to trigger after every request after the initial threshold, made more complicated by the Hydra tool submitting multiple requests at once. But the threshold component will generate one every 20 requests.
So the full rule will be:
alert ip any any -> $NAS_SERVER 445 (msg:"ATTACK - Potential SMB brute force against NAS"; flow:to_server,established; threshold: type threshold, track by_src, count 20, seconds 60; classtype:policy-violation; sid:1000002; rev:1;)
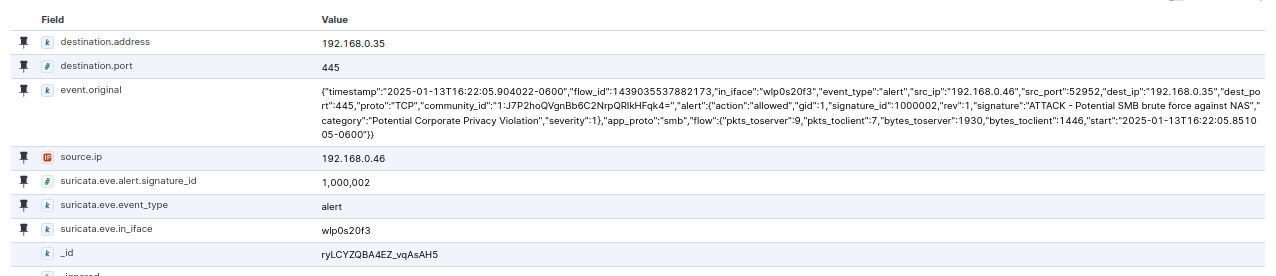
Then we run Hydra again (300 line password list), and as we can see there are probably still too many requests (120), likely again because of Hydra’s simultaneous threads.
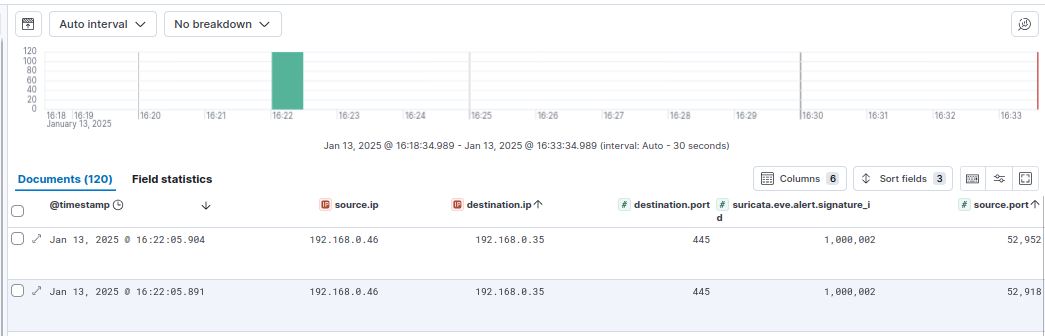
But hey, it’s down 90%, so that’s good enough for now. We can click into one of the events and see all of the same data as the other rules.
Final Note on NAS Rules
I did try and trigger the web portal rule using a proprietary service offered by the NAS, by it seems that the service was allowing access through the servers owned by the developers of the NAS, so I wasn’t able to trigger any rules. I didn’t expect to, but it was worth a shot.
Also, in a production environment, I would want to tune the alerts on the Port scanning rule with a threshold component as well since they generated far too many alerts. But to show how everything works, this was fine.
Web Application Alerts
Next I want to test some Suricata rules for a web application called Juice Shop. Developed by OWASP, Juice is a pretty sophisticated intentionally insecure web application for trainings and demos. It’s also very easy to install and run with docker. Ideally I wouldn’t install it on the same machine as the Kibana server, but it will work fine for testing rules. Once you have docker installed, the commands are simply:
sudo docker pull bkimminich/juice-shopsudo docker run --rm -p 3000:3000 bkimminich/juice-shop- Then check that the application is up on
http://localhost:3000.
We do need to make a couple changes to the /etc/suricata/suricata.yamlfile if we go about it like this because starting docker creates a new network interface and subnet that we need to account for. To do this we need to grab the IP of the container by running sudo docker ps, grabbing the container ID, and then running sudo docker inspect $containerID | grep IPAddress which in my case is 172.17.0.2.
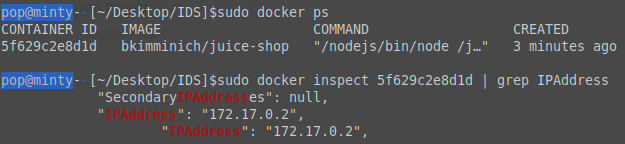
Then add that as a parameter to the config file, in my case as HTTP_SERVERS:
Then we add the docker0 interface:
Authentication Bypass via SQLi
As I said, Juice Shop is a pretty popular training application, and I’ve used it myself to practice exploits, so it’s pretty trivial to find known vulnerabilities. I think doing a walk-through is outside the scope of this already long post, so instead I’m just going to provide some significant exploits and then create rules around them. The first one is an authentication bypass on the login page which we can find at http://localhost:3000/#/login.
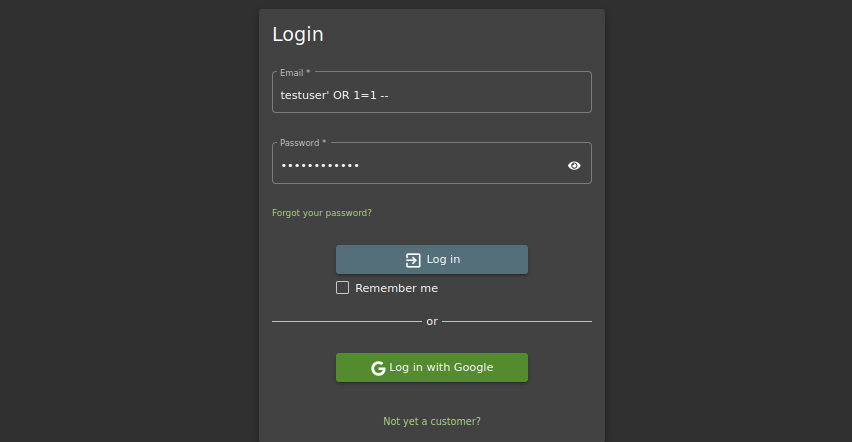
The request looks like this:
POST /rest/user/login HTTP/1.1
Host: localhost:3000
User-Agent: Mozilla/5.0 (X11; Linux x86_64; rv:133.0) Gecko/20100101 Firefox/133.0
Accept: application/json, text/plain, */*
Accept-Language: en-US,en;q=0.5
Accept-Encoding: gzip, deflate, br
Content-Type: application/json
Content-Length: 60
Origin: http://localhost:3000
Connection: keep-alive
Referer: http://localhost:3000/

...

{
	"email":"testuser ' OR 1=1 --",
		"password":"test password "
}
So the full endpoint is http://localhost:3000/rest/user/login and we would want to alert on “' OR 1=1”. A sample rule for this could look like this:
# SQLi
alert http any any -> $HTTP_SERVERS 3000 (\
msg:"SQL Injection in login attempt detected"; \
flow:established,to_server; content:"POST"; \
http_method; http.uri; content:"/rest/user/login"; \
http.request_body; content:"' OR 1=1"; nocase; \
classtype:attempted-admin; \
sid:1000005; \
rev:1;)
This rule would alert any time someone tried to authenticate to that endpoint using a username or password which includes the string “' OR 1=1'”. This is by no means the only way to perform SQLi Authentication Bypass, but if someone was trying to use an exploit like this, they would likely try use this string at some point in their attempts.
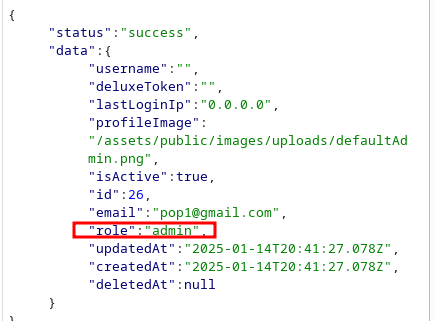
Excessive Permissions
One other way that we can exploit this application is to create a new user through the /register page, intercept the request, and change the role value from “customer” to “admin” giving our user excessive permissions over the application. The request looks like this:
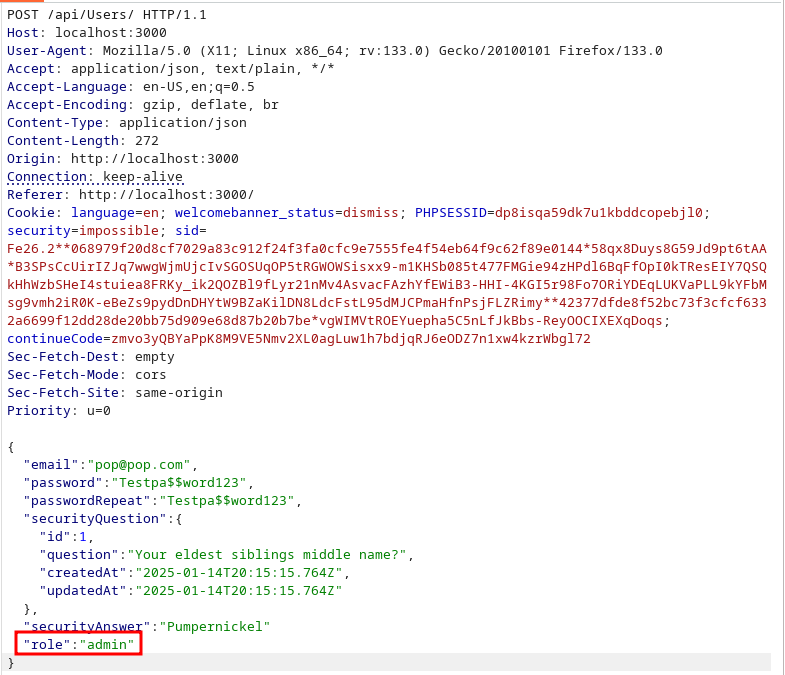
For reference, this field is not there in the initial request, but we can see it in the response. By default, it says ‘customer’, but we can change it to admin.
In this case we can create a rule that generates an alert if we see the role parameter and admin content. It could look like this:
alert http any any -> $HTTP_SERVERS 3000 (\
msg:"New admin registration attempted"; \
flow:established,to_server; \
content:"POST"; http_method; \
http.uri; content:"/api/Users"; \
http.content_type; content:"application/json"; \
http.request_body; content:"role"; nocase; \
http.request_body; content:"admin"; nocase;  \
classtype:attempted-admin; \
sid:1000006; \
rev:1;)
Login Brute Force
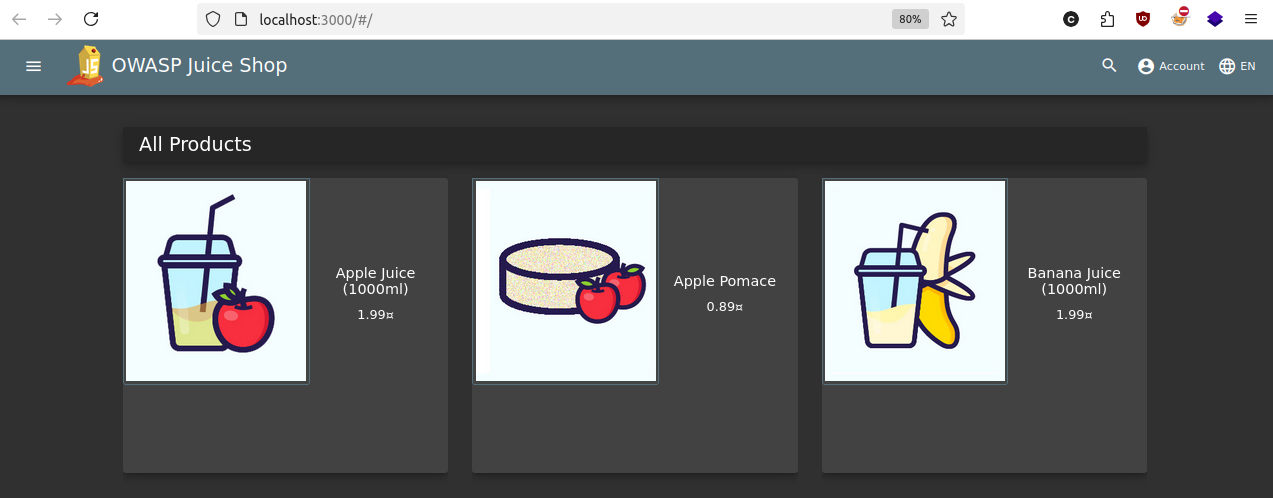
We’ll head back to the login page for this one. I happen to know that if we check the product page for Apple Juice we can see the Administrator’s email:

That’s no ideal. If someone see that, they could use it to brute force the admin user at the login screen. We should set up an alert to check if the login page is being brute forced. It will look like this:
# Brute Force Login
alert http any any -> $HTTP_SERVERS 3000 (\
msg:"Potential brute force attack against login endpoint"; \
flow:established,to_server; \
content:"POST"; http_method; \
http.uri; content:"/rest/user/login"; \
http.content_type; content:"application/json"; \
http.request_body; content:"email"; nocase; \
http.request_body; content:"password"; nocase; \
threshold:type threshold, track by_src, count 5, seconds 30; \
classtype:attempted-admin; \
sid:100007; \
rev:1;)
This rule will generate an alert when someone attempts to log in 5 times within 30 seconds using the threshold component. We can test this by capturing a login request using the admin@juice-sh.op user, and then using Burp Suite’s Intruder module to spray passwords from one of our previous wordlist. The request will look like this, where we can see we have highlighted the password field to spray:
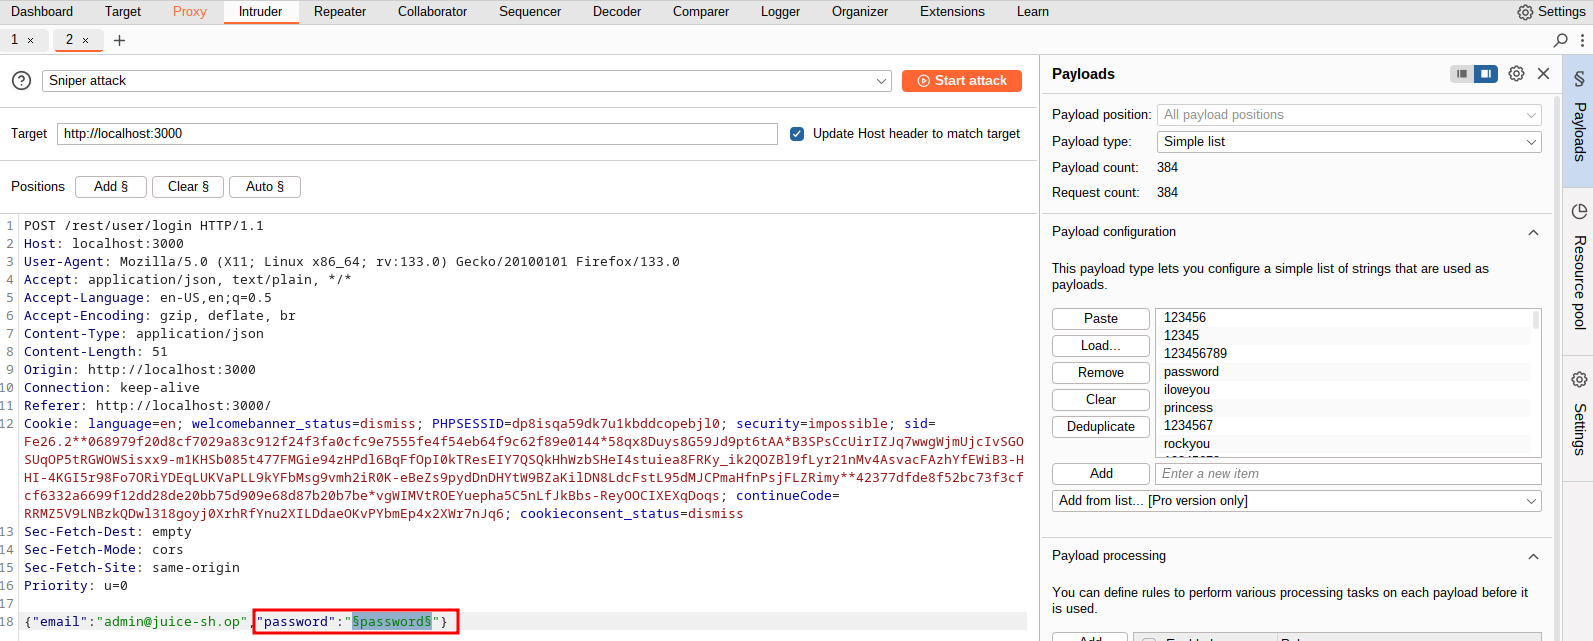
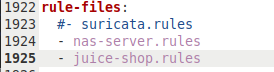
I can save all of the as /etc/suricata/rules/juice-shop.rules and make sure to update suricata.yaml to include them.
Juice-Shop Results
After performing some testing (and a several hours of figuring out what I did wrong), I can go to the Discover page, and filter out for my rule id’s with: suricata.eve.alert.signature_id : (1000005 OR 1000006 OR 1000007)
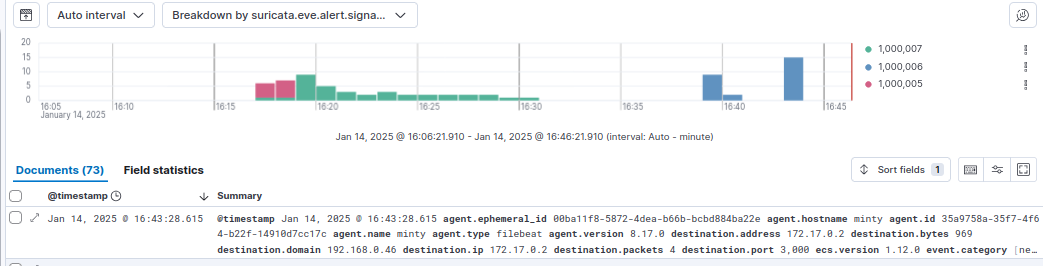
Thankfully, there are only 73 this time. One interesting thing that I noticed is that if I break it down by source.ip, there are two IPs - 172.17.0.1 and 192.168.0140.
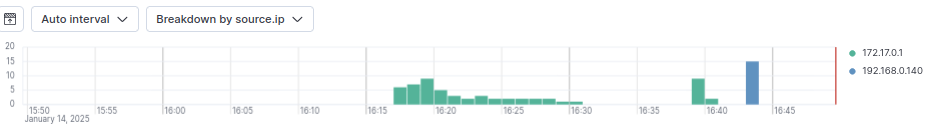
The first one is the gateway for the docker interface on the Linux machine I’ve been using to perform these tests which hosts Docker, Suricata, and Kibana. The second machine is a laptop I used to access Docker from the web browser to perform a few attempts to create the admin user. I would have perhaps expected the Linux machine’s IP address to be its 192 address, but because Docker is running on it, it is assigned the gateway address of 172.17.0.1. If we click into one of the alerts generated by the docker host, we can see it’s host.ip is still 192.168.0.46, referring to the docker host:
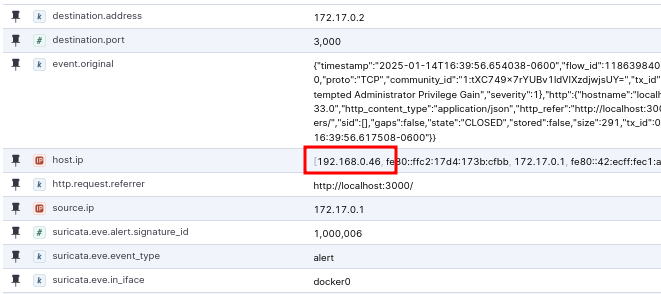
If we check the same fields coming from the 192.168.0.140 machine, we can see that the host.ip is still 192.168.0.46, but the http.request.referer now shows the full IP rather than localhost:
I am not going to click into each kind of alert for this section as it’s pretty redundant.
Auditbeat
As previously stated, Auditbeat doesn’t monitor the network so much as monitor user and process activities on the system on the system where it is installed. In my case, I’ve installed it on my Debian machine and set it up to send alert to Elasticsearch already. Now we just need to define some rules, which is a little bit different for Auditbeat than it is for Suricata. We have the option to create rule files or edit the /etc/auditbeat/auditbeat.yml file to add rules directly. In a production environment, it might make more sense to create rule files, but for testing purposes, I will edit the config file. By default, it already has some rules enabled:
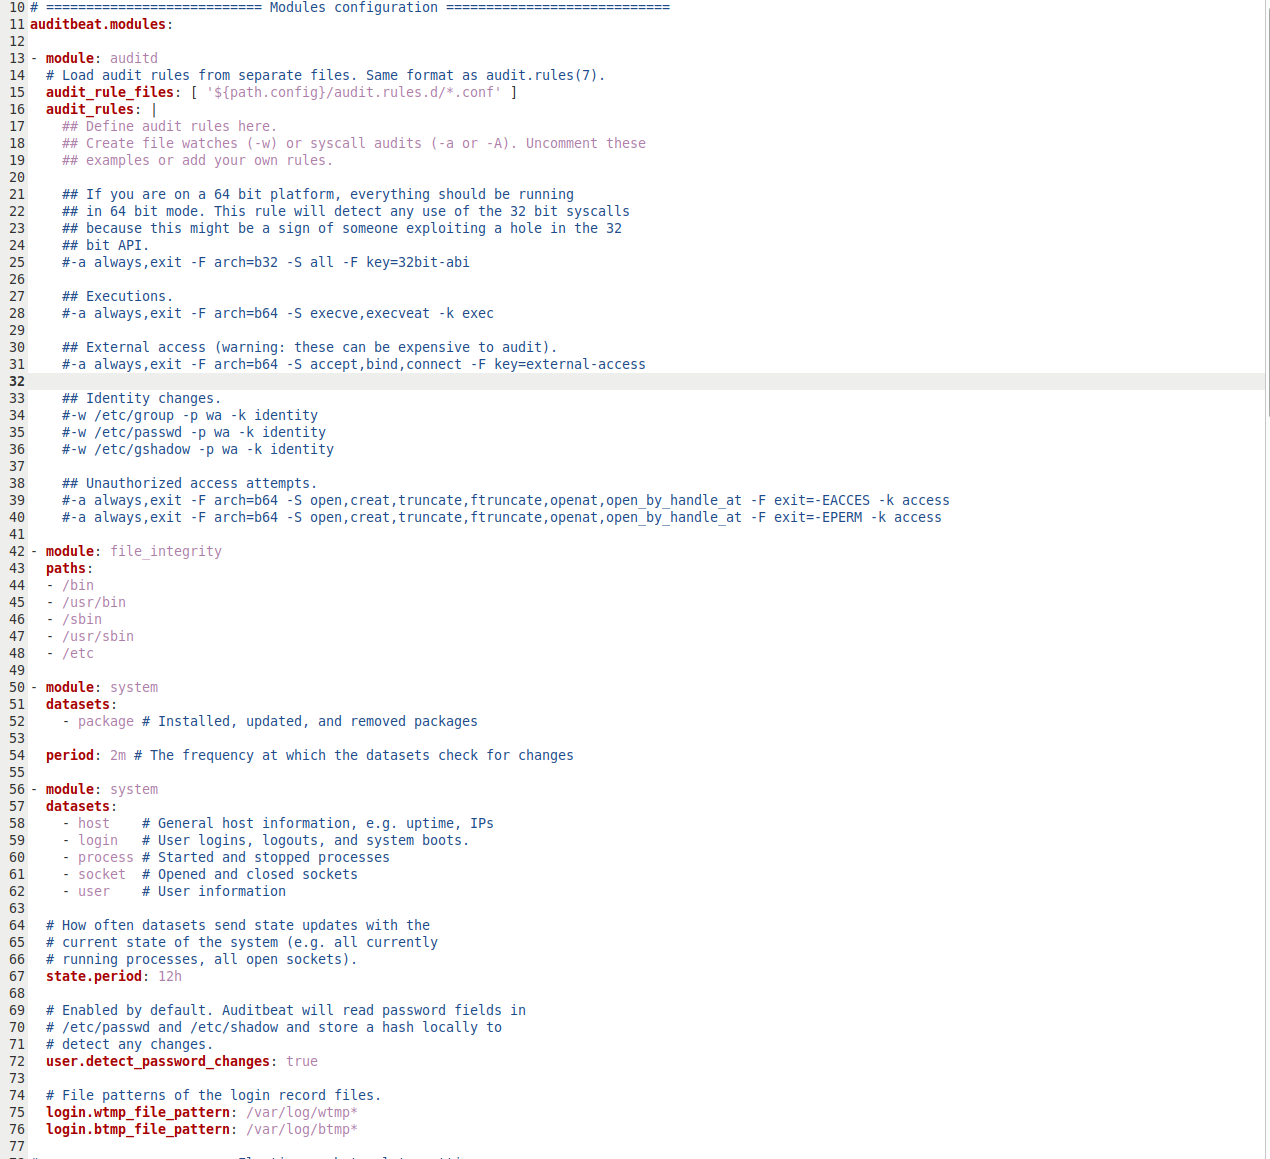
And as such, we can find event in Kibana already. But let’s add a few rules for testing as well. Let’s take a sample rule from the file above and break it down: -w /etc/passwd -p wa -k identity
-wrefers to thewatchaction because Auditbeat is monitoring that file-prefers to permissions, in this case thewrite access permission, and theattribute changes permission.-kis a key name to help identify in the logs.
Another sample rule is: -a always,exit -F arch=b64 -S open,creat,truncate,ftruncate,openat,open_by_handle_at -F exit=-EACCES -k access
-adefines when a rules is triggered, in this casealwaysuponexit.-Fis the field filter which sets conditions to filter events, in this case specifying 64-bit architecture.- The second field filter refers to when access is denied.
-Srefers to system calls, in the caseopen,creat,truncate,ftruncate,openat,open_by_handle_at
All together, this rule logs attempts where the access is denied, but if it said -F exit=-EPERM that would be for attempts when file permissions prevent the operation.
Audit Alerts
Let’s add some sample alerts for a few scenarios:
- When a user is added to the system:
-w /usr/sbin/useradd -p x -k identity- Tested with
sudo useradd testuser
- When a root command is executed:
-a exit,always -F arch=b64 -F euid=0 -S execve -k root_command- Tested with
sudo $anything
- When a binary file is modified:
-w /usr/bin -p wa -k binary_modification-w /usr/sbin -p wa -k binary_modification- Tested in this case by simply adding text files to these directories.
Audit Results
After running a few of these commands multiple times, I can go to the Discover page and view my results with the filter agent.type: auditbeat AND tags: (binary_modification OR root_command OR identity):
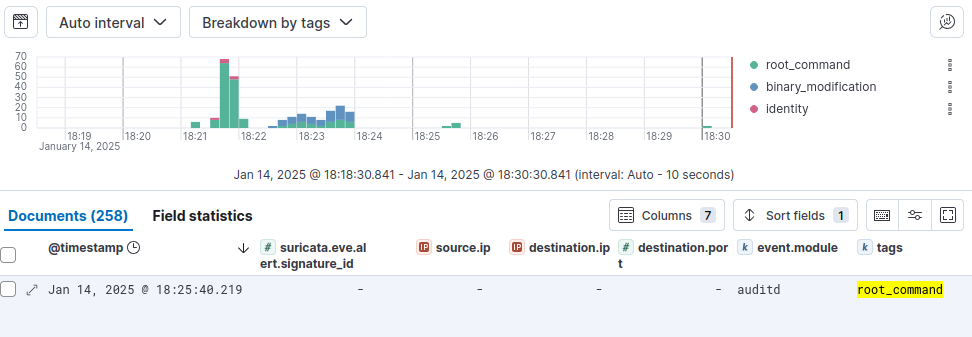
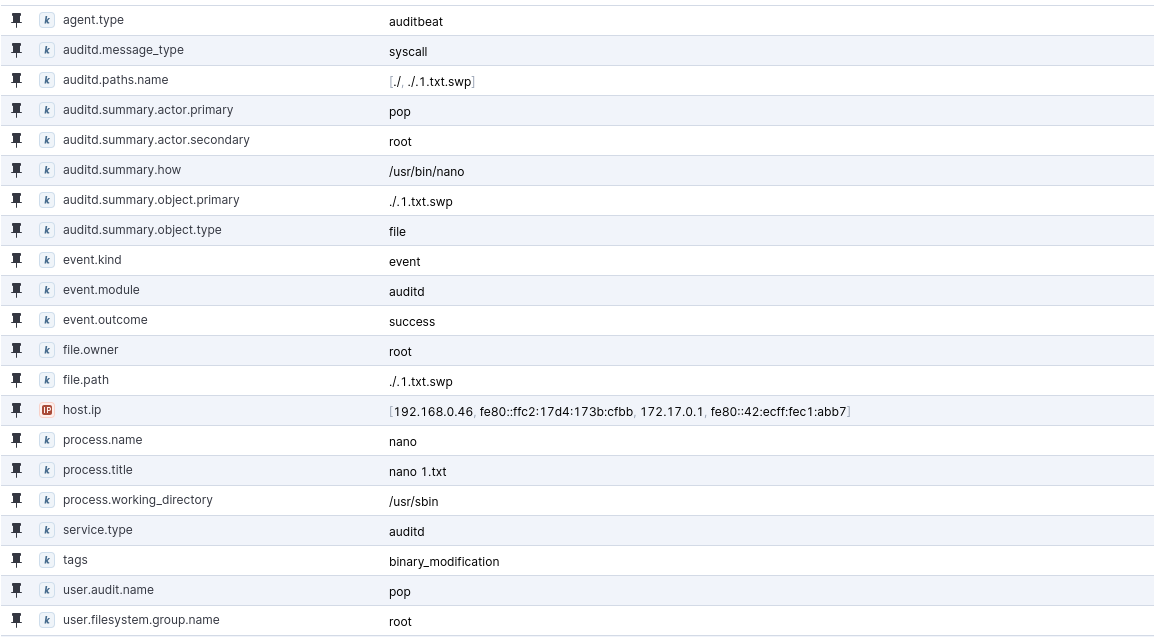
As we can say, there are a lot more root_command tags because the other test commands needed to be run with sudo. I’m not sure it makes much sends to keep this rule in a production environment. There is a ton of information in each of these logs, but I went ahead and pinned a few key fields to view in this sample binary_modification event from when I was creating a text file in the /usr/sbin directory:
Final Thoughts
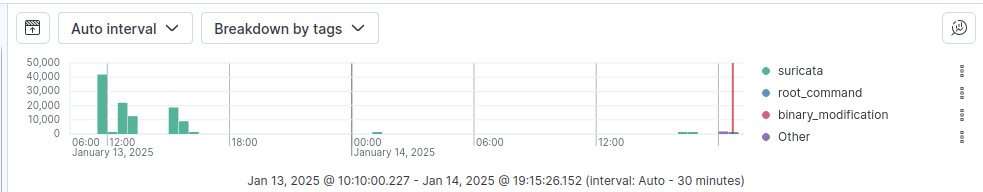
Wow, what a thrill ride. And if I’m honest, we barely even scratched the surface with this post. We could add a ton of rules, create some visualizations, and set up notifications so that we could get alerts to email or a chat. It might be cool to add IoT devices like a Ring Camera at some point, but for it looks like we’re at over 6,700 words at this point, so I’m gonna leave it with the breakdown of every alert I generated.
(agent.type: auditbeat AND tags: (binary_modification OR root_command OR identity)) OR suricata.eve.alert.signature_id:(1000001 OR 1000002 OR 1000003 OR 1000004 OR 1000005 OR 1000006 OR 1000007)
Thanks for reading!